Pearson Corr. Coef.
Module Interface
- class torchmetrics.PearsonCorrCoef(num_outputs=1, **kwargs)[source]
Compute Pearson Correlation Coefficient.
\[P_{corr}(x,y) = \frac{cov(x,y)}{\sigma_x \sigma_y}\]Where \(y\) is a tensor of target values, and \(x\) is a tensor of predictions.
As input to
forwardandupdatethe metric accepts the following input:preds(Tensor): either single output float tensor with shape(N,)or multioutput float tensor of shape(N,d)target(Tensor): either single output tensor with shape(N,)or multioutput tensor of shape(N,d)
As output of
forwardandcomputethe metric returns the following output:pearson(Tensor): A tensor with the Pearson Correlation Coefficient
- Parameters:
num_outputs¶ (
int) – Number of outputs in multioutput settingkwargs¶ (
Any) – Additional keyword arguments, see Advanced metric settings for more info.
- Example (single output regression):
>>> from torchmetrics.regression import PearsonCorrCoef
>>> target = torch.tensor([3, -0.5, 2, 7])
>>> preds = torch.tensor([2.5, 0.0, 2, 8])
>>> pearson = PearsonCorrCoef()
>>> pearson(preds, target)
tensor(0.9849)
- Example (multi output regression):
>>> from torchmetrics.regression import PearsonCorrCoef
>>> target = torch.tensor([[3, -0.5], [2, 7]])
>>> preds = torch.tensor([[2.5, 0.0], [2, 8]])
>>> pearson = PearsonCorrCoef(num_outputs=2)
>>> pearson(preds, target)
tensor([1., 1.])
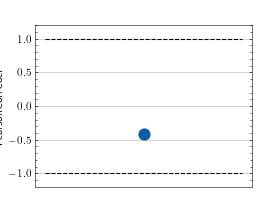
- plot(val=None, ax=None)[source]
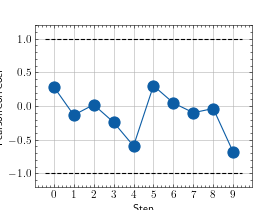
Plot a single or multiple values from the metric.
- Parameters:
val¶ (
Union[Tensor,Sequence[Tensor],None]) – Either a single result from calling metric.forward or metric.compute or a list of these results. If no value is provided, will automatically call metric.compute and plot that result.ax¶ (
Optional[Axes]) – An matplotlib axis object. If provided will add plot to that axis
- Return type:
- Returns:
Figure and Axes object
- Raises:
ModuleNotFoundError – If matplotlib is not installed
>>> from torch import randn
>>> # Example plotting a single value
>>> from torchmetrics.regression import PearsonCorrCoef
>>> metric = PearsonCorrCoef()
>>> metric.update(randn(10,), randn(10,))
>>> fig_, ax_ = metric.plot()
>>> from torch import randn
>>> # Example plotting multiple values
>>> from torchmetrics.regression import PearsonCorrCoef
>>> metric = PearsonCorrCoef()
>>> values = []
>>> for _ in range(10):
...     values.append(metric(randn(10,), randn(10,)))
>>> fig, ax = metric.plot(values)
Functional Interface
- torchmetrics.functional.pearson_corrcoef(preds, target)[source]
Compute pearson correlation coefficient.
- Parameters:
- Return type:
- Example (single output regression):
>>> from torchmetrics.functional.regression import pearson_corrcoef
>>> target = torch.tensor([3, -0.5, 2, 7])
>>> preds = torch.tensor([2.5, 0.0, 2, 8])
>>> pearson_corrcoef(preds, target)
tensor(0.9849)
- Example (multi output regression):
>>> from torchmetrics.functional.regression import pearson_corrcoef
>>> target = torch.tensor([[3, -0.5], [2, 7]])
>>> preds = torch.tensor([[2.5, 0.0], [2, 8]])
>>> pearson_corrcoef(preds, target)
tensor([1., 1.])
