Weighted MAPE
Module Interface
- class torchmetrics.WeightedMeanAbsolutePercentageError(**kwargs)[source]
Compute weighted mean absolute percentage error (WMAPE).
The output of WMAPE metric is a non-negative floating point, where the optimal value is 0. It is computes as:
\[\text{WMAPE} = \frac{\sum_{t=1}^n | y_t - \hat{y}_t | }{\sum_{t=1}^n |y_t| }\]Where \(y\) is a tensor of target values, and \(\hat{y}\) is a tensor of predictions.
As input to
forwardandupdatethe metric accepts the following input:As output of
forwardandcomputethe metric returns the following output:wmape(Tensor): A tensor with non-negative floating point wmape value between 0 and 1
- Parameters:
kwargs¶ (
Any) – Additional keyword arguments, see Advanced metric settings for more info.
Example
>>> import torch
>>> _ = torch.manual_seed(42)
>>> preds = torch.randn(20,)
>>> target = torch.randn(20,)
>>> wmape = WeightedMeanAbsolutePercentageError()
>>> wmape(preds, target)
tensor(1.3967)
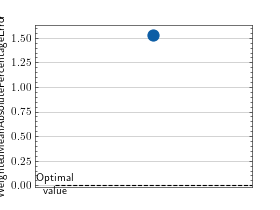
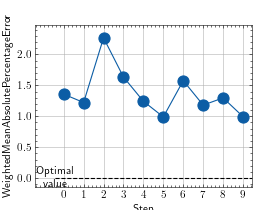
- plot(val=None, ax=None)[source]
Plot a single or multiple values from the metric.
- Parameters:
val¶ (
Union[Tensor,Sequence[Tensor],None]) – Either a single result from calling metric.forward or metric.compute or a list of these results. If no value is provided, will automatically call metric.compute and plot that result.ax¶ (
Optional[Axes]) – An matplotlib axis object. If provided will add plot to that axis
- Return type:
- Returns:
Figure and Axes object
- Raises:
ModuleNotFoundError – If matplotlib is not installed
>>> from torch import randn
>>> # Example plotting a single value
>>> from torchmetrics.regression import WeightedMeanAbsolutePercentageError
>>> metric = WeightedMeanAbsolutePercentageError()
>>> metric.update(randn(10,), randn(10,))
>>> fig_, ax_ = metric.plot()
>>> from torch import randn
>>> # Example plotting multiple values
>>> from torchmetrics.regression import WeightedMeanAbsolutePercentageError
>>> metric = WeightedMeanAbsolutePercentageError()
>>> values = []
>>> for _ in range(10):
...     values.append(metric(randn(10,), randn(10,)))
>>> fig, ax = metric.plot(values)
Functional Interface
- torchmetrics.functional.weighted_mean_absolute_percentage_error(preds, target)[source]
Compute weighted mean absolute percentage error (WMAPE).
The output of WMAPE metric is a non-negative floating point, where the optimal value is 0. It is computes as:
\[\text{WMAPE} = \frac{\sum_{t=1}^n | y_t - \hat{y}_t | }{\sum_{t=1}^n |y_t| }\]Where \(y\) is a tensor of target values, and \(\hat{y}\) is a tensor of predictions.
- Parameters:
- Return type:
- Returns:
Tensor with WMAPE.
Example
>>> import torch
>>> _ = torch.manual_seed(42)
>>> preds = torch.randn(20,)
>>> target = torch.randn(20,)
>>> weighted_mean_absolute_percentage_error(preds, target)
tensor(1.3967)
