
Spearman Corr. Coef.
Module Interface
- class torchmetrics.SpearmanCorrCoef(num_outputs=1, **kwargs)[source]
Compute spearmans rank correlation coefficient.
where
 and
and  are the rank associated to the variables
  and
and  .
Spearmans correlations coefficient corresponds to the standard pearsons correlation coefficient calculated
on the rank variables.
.
Spearmans correlations coefficient corresponds to the standard pearsons correlation coefficient calculated
on the rank variables.As input to
forwardandupdatethe metric accepts the following input:preds(Tensor): Predictions from model in float tensor with shape(N,d)target(Tensor): Ground truth values in float tensor with shape(N,d)
As output of
forwardandcomputethe metric returns the following output:spearman(Tensor): A tensor with the spearman correlation(s)
- Parameters:
num_outputs¶ (
int) – Number of outputs in multioutput settingkwargs¶ (
Any) – Additional keyword arguments, see Advanced metric settings for more info.
- Example (single output regression):
>>> from torch import tensor
>>> from torchmetrics.regression import SpearmanCorrCoef
>>> target = tensor([3, -0.5, 2, 7])
>>> preds = tensor([2.5, 0.0, 2, 8])
>>> spearman = SpearmanCorrCoef()
>>> spearman(preds, target)
tensor(1.0000)
- Example (multi output regression):
>>> from torchmetrics.regression import SpearmanCorrCoef
>>> target = tensor([[3, -0.5], [2, 7]])
>>> preds = tensor([[2.5, 0.0], [2, 8]])
>>> spearman = SpearmanCorrCoef(num_outputs=2)
>>> spearman(preds, target)
tensor([1.0000, 1.0000])
- plot(val=None, ax=None)[source]
Plot a single or multiple values from the metric.
- Parameters:
val¶ (
Union[Tensor,Sequence[Tensor],None]) – Either a single result from calling metric.forward or metric.compute or a list of these results. If no value is provided, will automatically call metric.compute and plot that result.ax¶ (
Optional[Axes]) – An matplotlib axis object. If provided will add plot to that axis
- Return type:
- Returns:
Figure and Axes object
- Raises:
ModuleNotFoundError – If matplotlib is not installed
>>> from torch import randn
>>> # Example plotting a single value
>>> from torchmetrics.regression import SpearmanCorrCoef
>>> metric = SpearmanCorrCoef()
>>> metric.update(randn(10,), randn(10,))
>>> fig_, ax_ = metric.plot()
(
Source code,png,hires.png,pdf)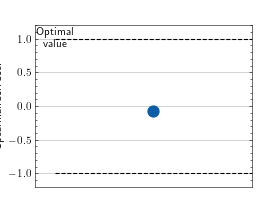
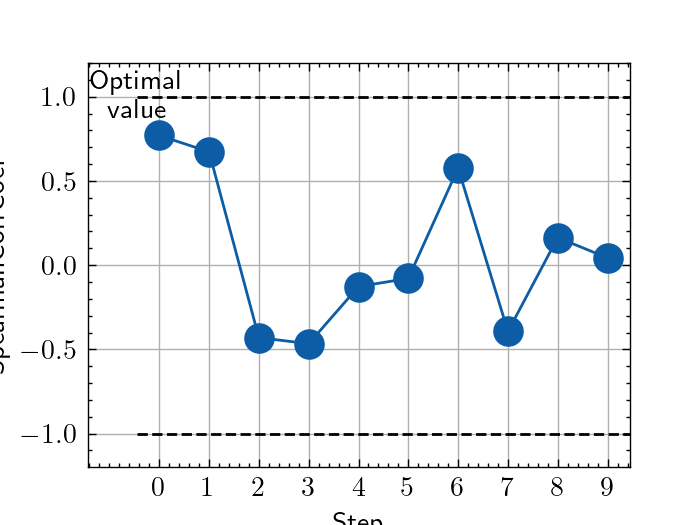
>>> from torch import randn
>>> # Example plotting multiple values
>>> from torchmetrics.regression import SpearmanCorrCoef
>>> metric = SpearmanCorrCoef()
>>> values = []
>>> for _ in range(10):
...     values.append(metric(randn(10,), randn(10,)))
>>> fig, ax = metric.plot(values)
(
Source code,png,hires.png,pdf)
Functional Interface
- torchmetrics.functional.spearman_corrcoef(preds, target)[source]
Compute spearmans rank correlation coefficient.
where
and are the rank associated to the variables x and y. Spearmans correlations
coefficient corresponds to the standard pearsons correlation coefficient calculated on the rank variables.- Parameters:
- Return type:
- Example (single output regression):
>>> from torchmetrics.functional.regression import spearman_corrcoef
>>> target = torch.tensor([3, -0.5, 2, 7])
>>> preds = torch.tensor([2.5, 0.0, 2, 8])
>>> spearman_corrcoef(preds, target)
tensor(1.0000)
- Example (multi output regression):
>>> from torchmetrics.functional.regression import spearman_corrcoef
>>> target = torch.tensor([[3, -0.5], [2, 7]])
>>> preds = torch.tensor([[2.5, 0.0], [2, 8]])
>>> spearman_corrcoef(preds, target)
tensor([1.0000, 1.0000])
