Minimum
Module Interface
- class torchmetrics.aggregation.MinMetric(nan_strategy='warn', **kwargs)[source]
Aggregate a stream of value into their minimum value.
As input to
forwardandupdatethe metric accepts the following inputAs output of forward and compute the metric returns the following output
agg(Tensor): scalar float tensor with aggregated minimum value over all inputs received
- Parameters:
nan_strategy¶ (
Union[str,float]) – options: -'error': if any nan values are encountered will give a RuntimeError -'warn': if any nan values are encountered will give a warning and continue -'ignore': all nan values are silently removed - a float: if a float is provided will impute any nan values with this valuekwargs¶ (
Any) – Additional keyword arguments, see Advanced metric settings for more info.
- Raises:
ValueError – If
nan_strategyis not one oferror,warn,ignoreor a float
Example
>>> from torch import tensor
>>> from torchmetrics.aggregation import MinMetric
>>> metric = MinMetric()
>>> metric.update(1)
>>> metric.update(tensor([2, 3]))
>>> metric.compute()
tensor(1.)
- plot(val=None, ax=None)[source]
Plot a single or multiple values from the metric.
- Parameters:
val¶ (
Union[Tensor,Sequence[Tensor],None]) – Either a single result from calling metric.forward or metric.compute or a list of these results. If no value is provided, will automatically call metric.compute and plot that result.ax¶ (
Optional[Axes]) – An matplotlib axis object. If provided will add plot to that axis
- Return type:
- Returns:
Figure and Axes object
- Raises:
ModuleNotFoundError – If matplotlib is not installed
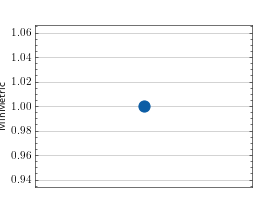
>>> # Example plotting a single value
>>> from torchmetrics.aggregation import MinMetric
>>> metric = MinMetric()
>>> metric.update([1, 2, 3])
>>> fig_, ax_ = metric.plot()
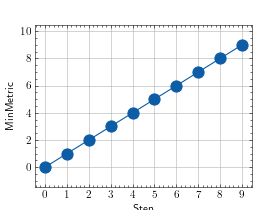
>>> # Example plotting multiple values
>>> from torchmetrics.aggregation import MinMetric
>>> metric = MinMetric()
>>> values = [ ]
>>> for i in range(10):
...     values.append(metric(i))
>>> fig_, ax_ = metric.plot(values)