Mean Absolute Percentage Error (MAPE)
Module Interface
- class torchmetrics.MeanAbsolutePercentageError(**kwargs)[source]
Compute Mean Absolute Percentage Error (MAPE).
\[\text{MAPE} = \frac{1}{n}\sum_{i=1}^n\frac{| y_i - \hat{y_i} |}{\max(\epsilon, | y_i |)}\]Where \(y\) is a tensor of target values, and \(\hat{y}\) is a tensor of predictions.
As input to
forwardandupdatethe metric accepts the following input:As output of
forwardandcomputethe metric returns the following output:mean_abs_percentage_error(Tensor): A tensor with the mean absolute percentage error over state
- Parameters:
kwargs¶ (
Any) – Additional keyword arguments, see Advanced metric settings for more info.
Note
MAPE output is a non-negative floating point. Best result is
0.0. But it is important to note that, bad predictions, can lead to arbitrarily large values. Especially when sometargetvalues are close to 0. This MAPE implementation returns a very large number instead ofinf.Example
>>> from torch import tensor
>>> from torchmetrics.regression import MeanAbsolutePercentageError
>>> target = tensor([1, 10, 1e6])
>>> preds = tensor([0.9, 15, 1.2e6])
>>> mean_abs_percentage_error = MeanAbsolutePercentageError()
>>> mean_abs_percentage_error(preds, target)
tensor(0.2667)
- plot(val=None, ax=None)[source]
Plot a single or multiple values from the metric.
- Parameters:
val¶ (
Union[Tensor,Sequence[Tensor],None]) – Either a single result from calling metric.forward or metric.compute or a list of these results. If no value is provided, will automatically call metric.compute and plot that result.ax¶ (
Optional[Axes]) – An matplotlib axis object. If provided will add plot to that axis
- Return type:
- Returns:
Figure and Axes object
- Raises:
ModuleNotFoundError – If matplotlib is not installed
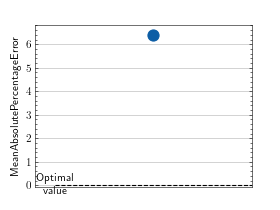
>>> from torch import randn
>>> # Example plotting a single value
>>> from torchmetrics.regression import MeanAbsolutePercentageError
>>> metric = MeanAbsolutePercentageError()
>>> metric.update(randn(10,), randn(10,))
>>> fig_, ax_ = metric.plot()
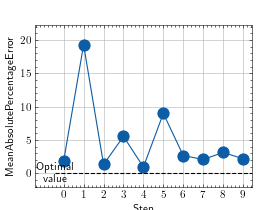
>>> from torch import randn
>>> # Example plotting multiple values
>>> from torchmetrics.regression import MeanAbsolutePercentageError
>>> metric = MeanAbsolutePercentageError()
>>> values = []
>>> for _ in range(10):
...     values.append(metric(randn(10,), randn(10,)))
>>> fig, ax = metric.plot(values)
Functional Interface
- torchmetrics.functional.mean_absolute_percentage_error(preds, target)[source]
Compute mean absolute percentage error.
- Parameters:
- Return type:
- Returns:
Tensor with MAPE
Note
The epsilon value is taken from scikit-learn’s implementation of MAPE.
Example
>>> from torchmetrics.functional.regression import mean_absolute_percentage_error
>>> target = torch.tensor([1, 10, 1e6])
>>> preds = torch.tensor([0.9, 15, 1.2e6])
>>> mean_absolute_percentage_error(preds, target)
tensor(0.2667)
