Rand Score
Module Interface
- class torchmetrics.clustering.RandScore(**kwargs)[source]
Compute Rand Score (alternatively known as Rand Index).
\[RS(U, V) = \text{number of agreeing pairs} / \text{number of pairs}\]The number of agreeing pairs is every \((i, j)\) pair of samples where \(i \in U\) and \(j \in V\) (the predicted and true clusterings, respectively) that are in the same cluster for both clusterings. The metric is symmetric, therefore swapping \(U\) and \(V\) yields the same rand score.
This clustering metric is an extrinsic measure, because it requires ground truth clustering labels, which may not be available in practice since clustering in generally is used for unsupervised learning.
As input to
forwardandupdatethe metric accepts the following input:preds(Tensor): single integer tensor with shape(N,)with predicted cluster labelstarget(Tensor): single integer tensor with shape(N,)with ground truth cluster labels
As output of
forwardandcomputethe metric returns the following output:rand_score(Tensor): A tensor with the Rand Score
- Parameters:
kwargs¶ (
Any) – Additional keyword arguments, see Advanced metric settings for more info.
- Example::
>>> import torch
>>> from torchmetrics.clustering import RandScore
>>> preds = torch.tensor([2, 1, 0, 1, 0])
>>> target = torch.tensor([0, 2, 1, 1, 0])
>>> metric = RandScore()
>>> metric(preds, target)
tensor(0.6000)
- plot(val=None, ax=None)[source]
Plot a single or multiple values from the metric.
- Parameters:
val¶ (
Union[Tensor,Sequence[Tensor],None]) – Either a single result from calling metric.forward or metric.compute or a list of these results. If no value is provided, will automatically call metric.compute and plot that result.ax¶ (
Optional[Axes]) – An matplotlib axis object. If provided will add plot to that axis
- Return type:
- Returns:
Figure and Axes object
- Raises:
ModuleNotFoundError – If matplotlib is not installed
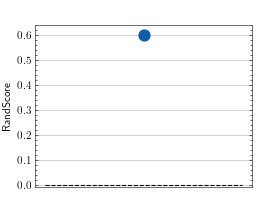
>>> # Example plotting a single value
>>> import torch
>>> from torchmetrics.clustering import RandScore
>>> metric = RandScore()
>>> metric.update(torch.randint(0, 4, (10,)), torch.randint(0, 4, (10,)))
>>> fig_, ax_ = metric.plot(metric.compute())
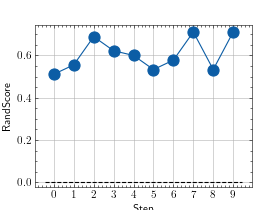
>>> # Example plotting multiple values
>>> import torch
>>> from torchmetrics.clustering import RandScore
>>> metric = RandScore()
>>> values = [ ]
>>> for _ in range(10):
...     values.append(metric(torch.randint(0, 4, (10,)), torch.randint(0, 4, (10,))))
>>> fig_, ax_ = metric.plot(values)
Functional Interface
- torchmetrics.functional.clustering.rand_score(preds, target)[source]
Compute the Rand score between two clusterings.
- Parameters:
- Return type:
- Returns:
scalar tensor with the rand score
Example
>>> from torchmetrics.functional.clustering import rand_score
>>> import torch
>>> rand_score(torch.tensor([0, 0, 1, 1]), torch.tensor([1, 1, 0, 0]))
tensor(1.)
>>> rand_score(torch.tensor([0, 0, 1, 2]), torch.tensor([0, 0, 1, 1]))
tensor(0.8333)
