Cosine Similarity
Module Interface
- class torchmetrics.CosineSimilarity(reduction='sum', **kwargs)[source]
Compute the Cosine Similarity.
\[cos_{sim}(x,y) = \frac{x \cdot y}{||x|| \cdot ||y||} = \frac{\sum_{i=1}^n x_i y_i}{\sqrt{\sum_{i=1}^n x_i^2}\sqrt{\sum_{i=1}^n y_i^2}}\]where \(y\) is a tensor of target values, and \(x\) is a tensor of predictions.
As input to
forwardandupdatethe metric accepts the following input:preds(Tensor): Predicted float tensor with shape(N,d)target(Tensor): Ground truth float tensor with shape(N,d)
As output of
forwardandcomputethe metric returns the following output:cosine_similarity(Tensor): A float tensor with the cosine similarity
- Parameters:
reduction¶ (
Literal['mean','sum','none',None]) – how to reduce over the batch dimension using ‘sum’, ‘mean’ or ‘none’ (taking the individual scores)kwargs¶ (
Any) – Additional keyword arguments, see Advanced metric settings for more info.
Example
>>> from torch import tensor
>>> from torchmetrics.regression import CosineSimilarity
>>> target = tensor([[0, 1], [1, 1]])
>>> preds = tensor([[0, 1], [0, 1]])
>>> cosine_similarity = CosineSimilarity(reduction = 'mean')
>>> cosine_similarity(preds, target)
tensor(0.8536)
- plot(val=None, ax=None)[source]
Plot a single or multiple values from the metric.
- Parameters:
val¶ (
Union[Tensor,Sequence[Tensor],None]) – Either a single result from calling metric.forward or metric.compute or a list of these results. If no value is provided, will automatically call metric.compute and plot that result.ax¶ (
Optional[Axes]) – An matplotlib axis object. If provided will add plot to that axis
- Return type:
- Returns:
Figure and Axes object
- Raises:
ModuleNotFoundError – If matplotlib is not installed
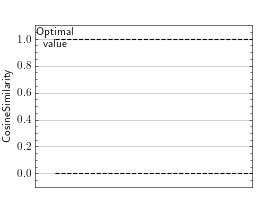
>>> from torch import randn
>>> # Example plotting a single value
>>> from torchmetrics.regression import CosineSimilarity
>>> metric = CosineSimilarity()
>>> metric.update(randn(10,2), randn(10,2))
>>> fig_, ax_ = metric.plot()
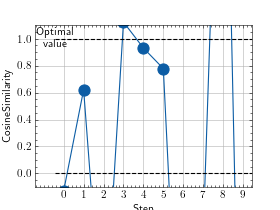
>>> from torch import randn
>>> # Example plotting multiple values
>>> from torchmetrics.regression import CosineSimilarity
>>> metric = CosineSimilarity()
>>> values = []
>>> for _ in range(10):
...     values.append(metric(randn(10,2), randn(10,2)))
>>> fig, ax = metric.plot(values)
Functional Interface
- torchmetrics.functional.cosine_similarity(preds, target, reduction='sum')[source]
Compute the Cosine Similarity.
\[cos_{sim}(x,y) = \frac{x \cdot y}{||x|| \cdot ||y||} = \frac{\sum_{i=1}^n x_i y_i}{\sqrt{\sum_{i=1}^n x_i^2}\sqrt{\sum_{i=1}^n y_i^2}}\]where \(y\) is a tensor of target values, and \(x\) is a tensor of predictions.
- Parameters:
- Return type:
Example
>>> from torchmetrics.functional.regression import cosine_similarity
>>> target = torch.tensor([[1, 2, 3, 4],
...                        [1, 2, 3, 4]])
>>> preds = torch.tensor([[1, 2, 3, 4],
...                       [-1, -2, -3, -4]])
>>> cosine_similarity(preds, target, 'none')
tensor([ 1.0000, -1.0000])
